- MPI benchmarks
- DTU Elektro cluster
- DTU HPC Cluster (Atea)
- DTU HPC Cluster (IBM NeXtScale)
- DTU Fotonano cluster
- DTU Risø cluster (Jess)
- SDU cluster (Abacus)
MPI benchmarks
Please note that the figures shown on this page are based on 2015-2017 clusters and may be outdated.
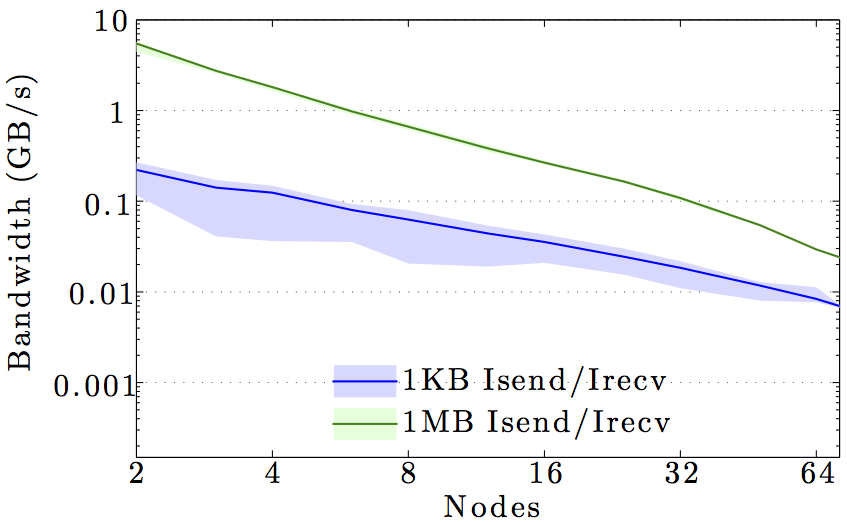
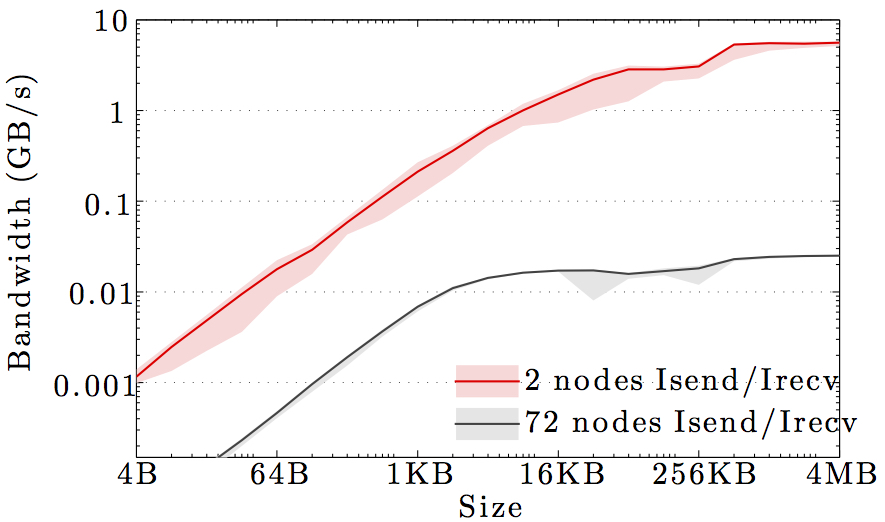
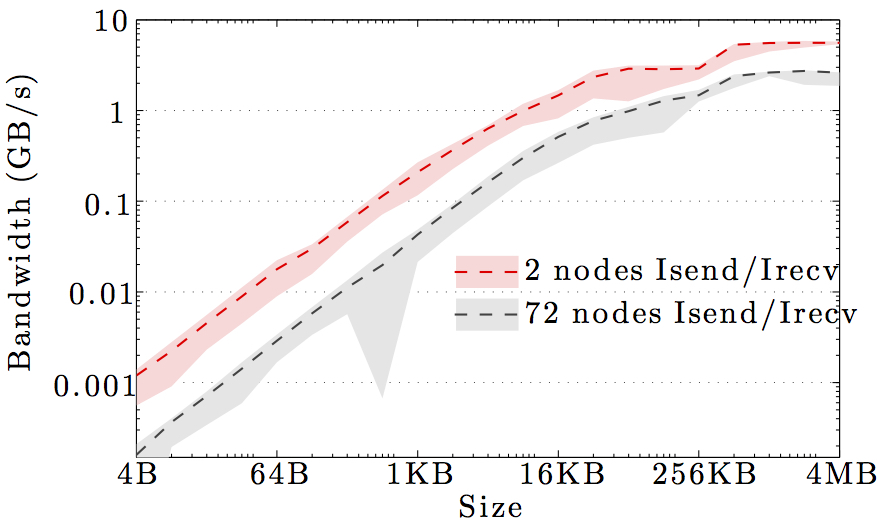
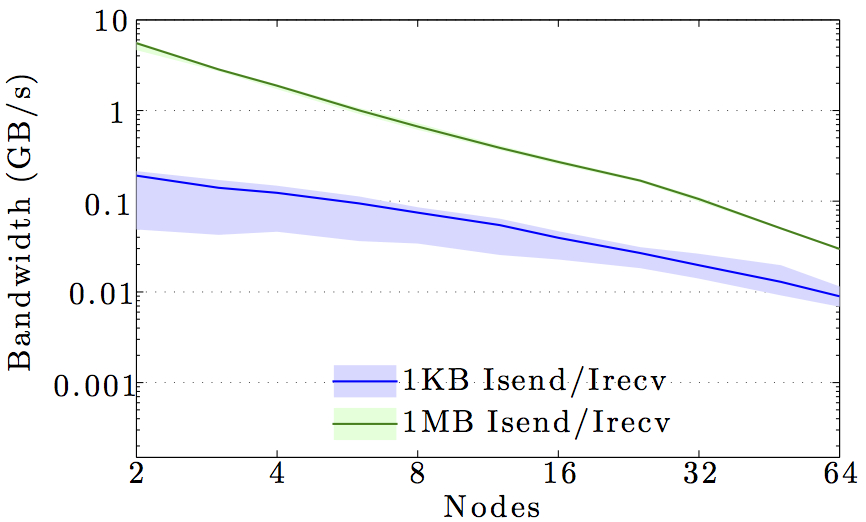
We display benchmarks of MPI communication on the main DTU clusters and the DeiC Abacus cluster at SDU.
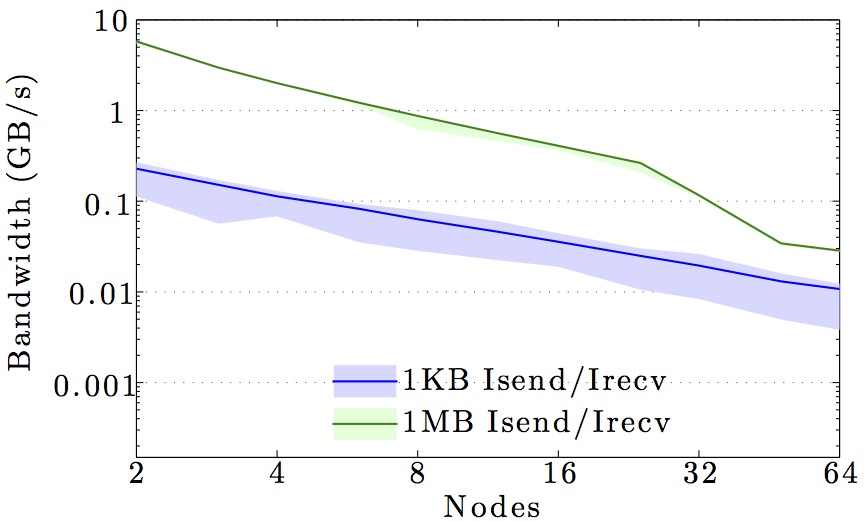
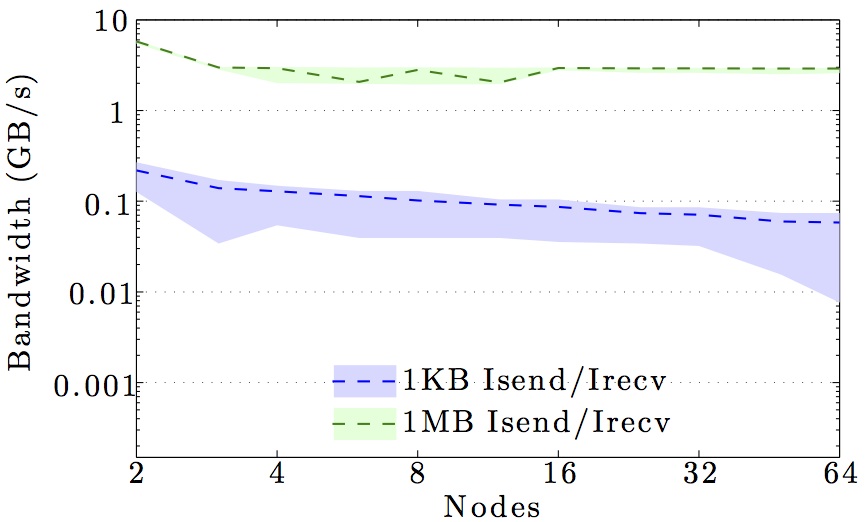
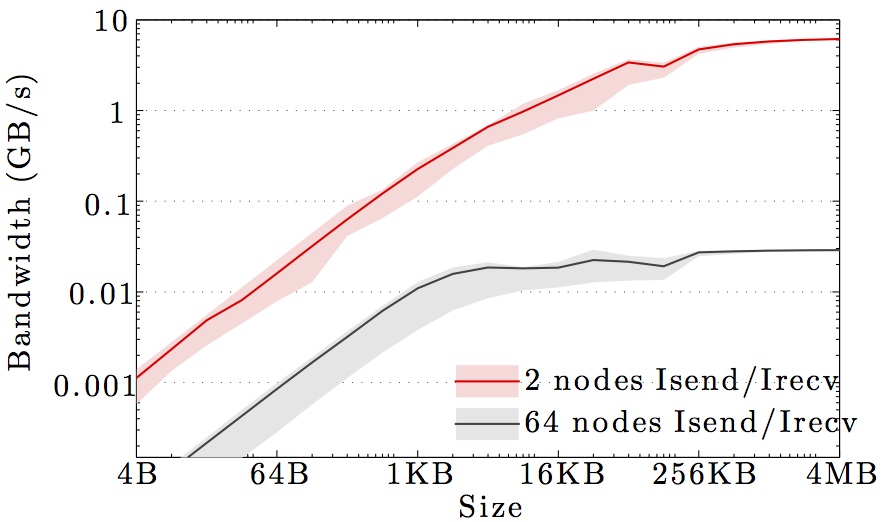
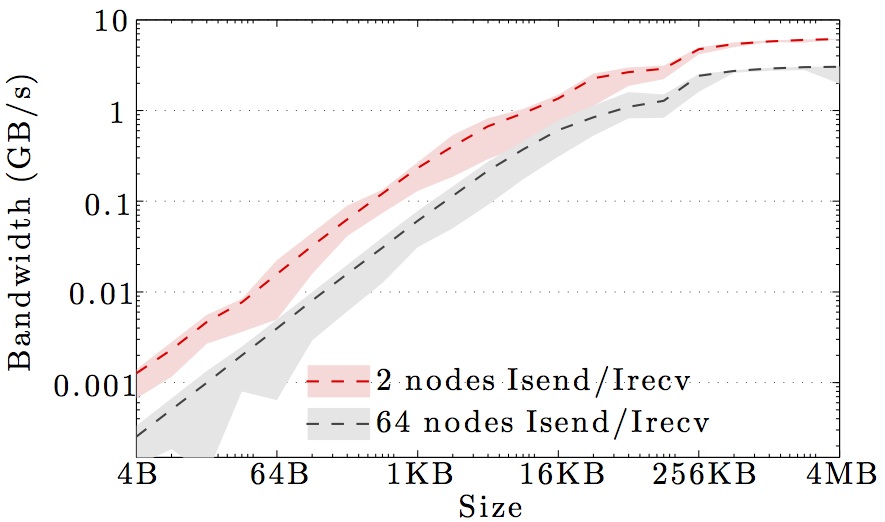
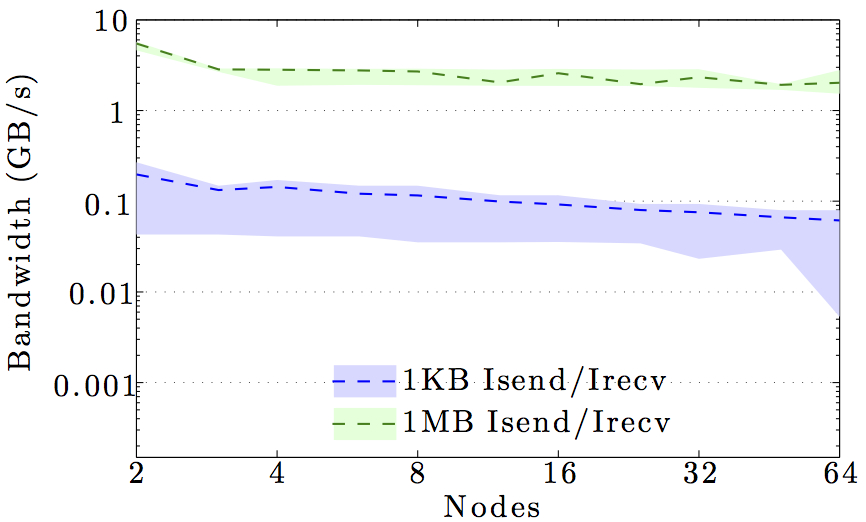
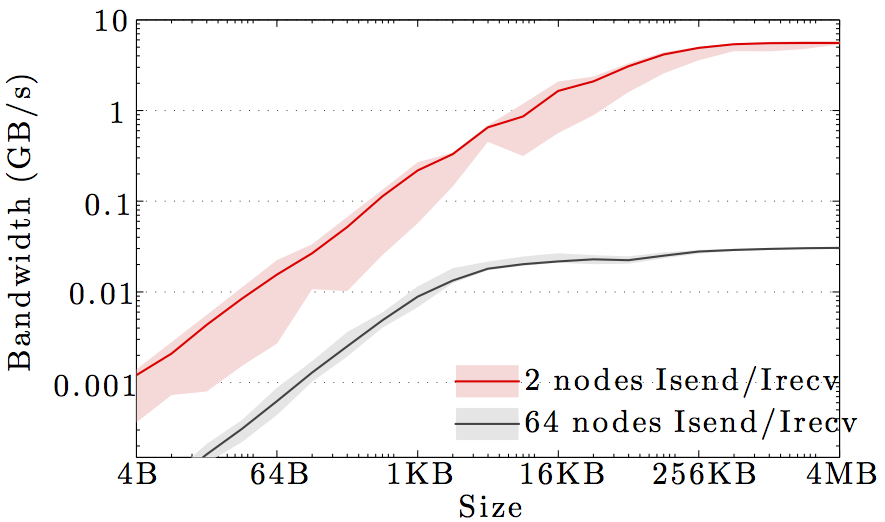
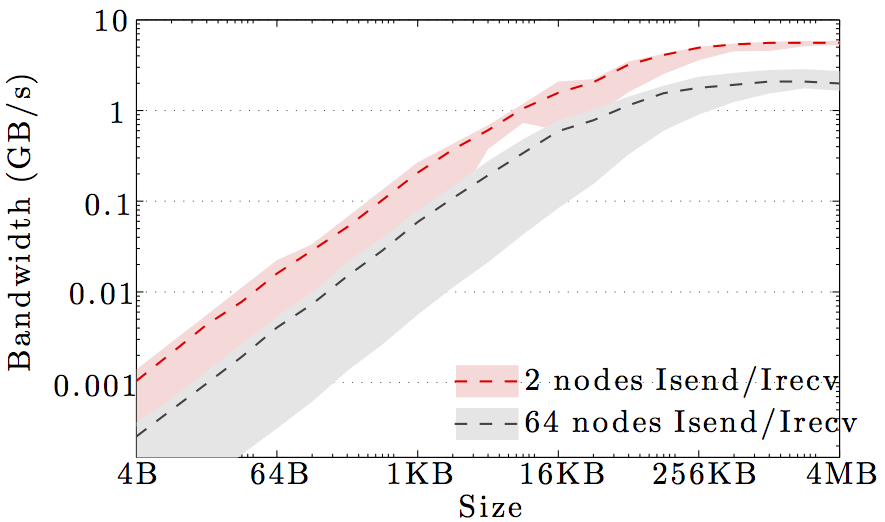
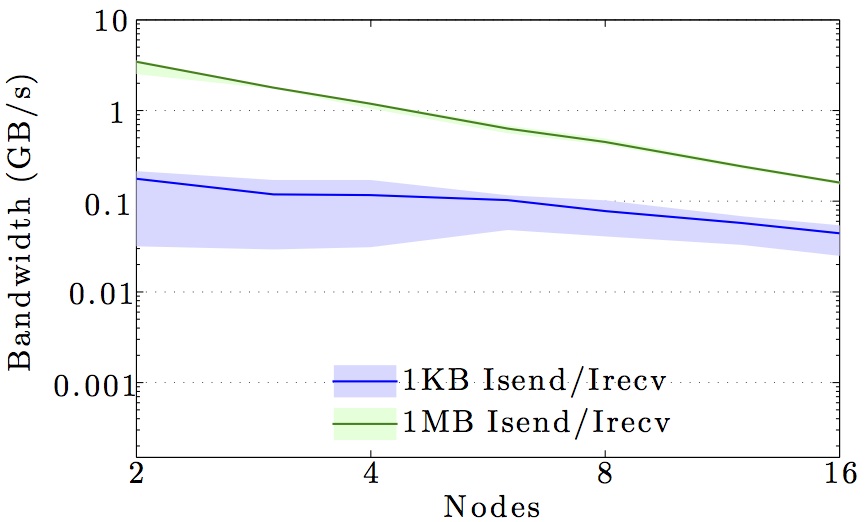
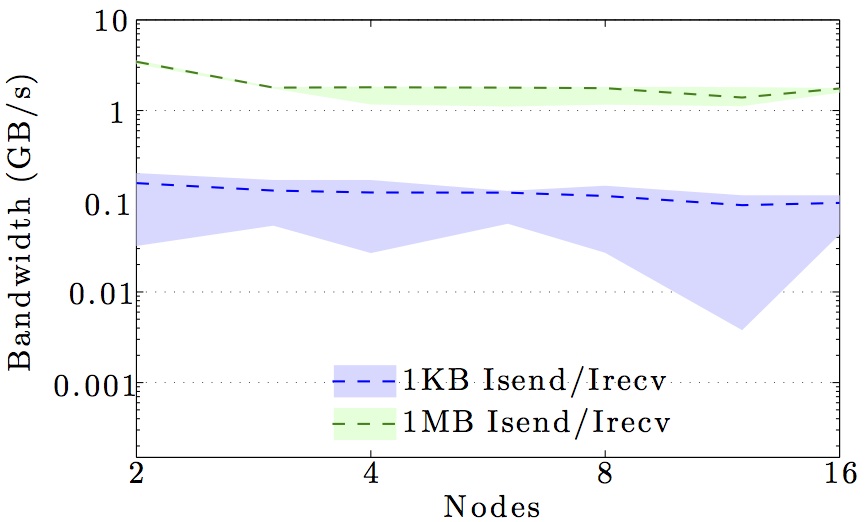
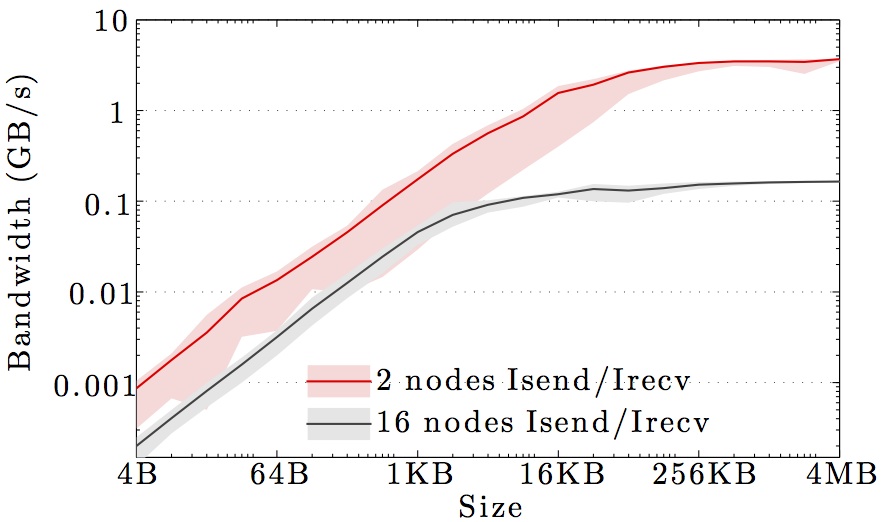
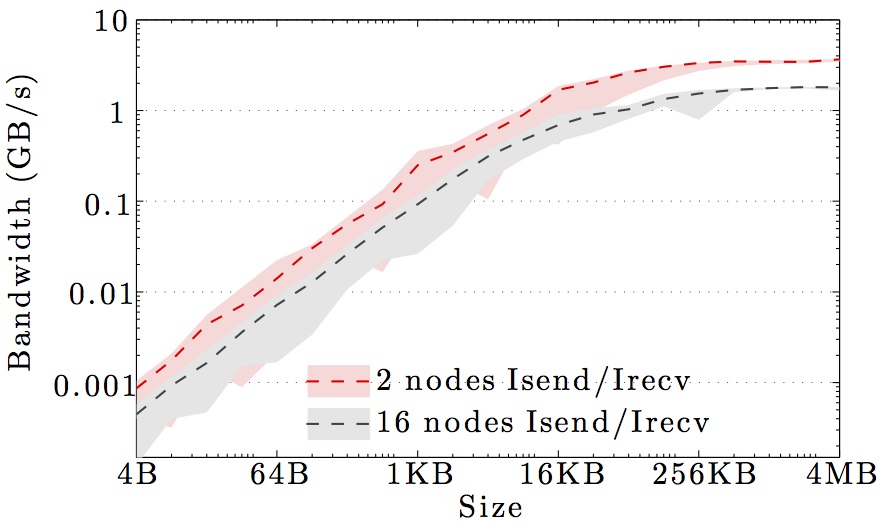
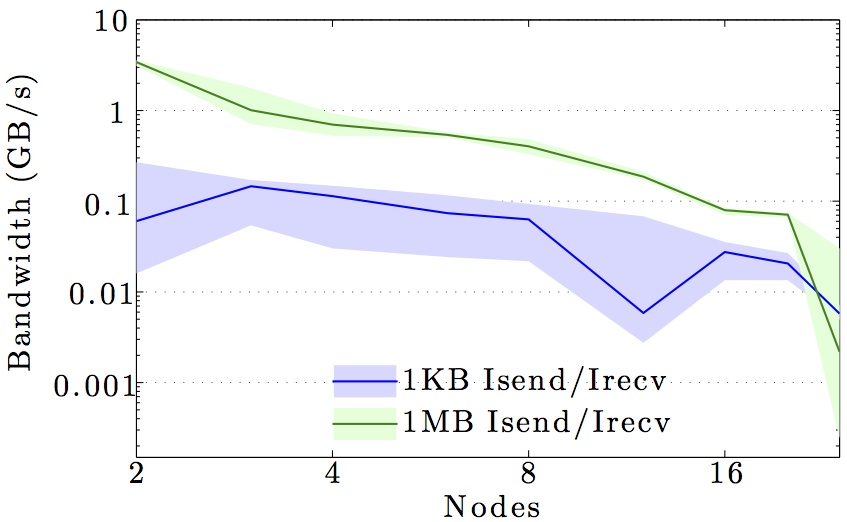
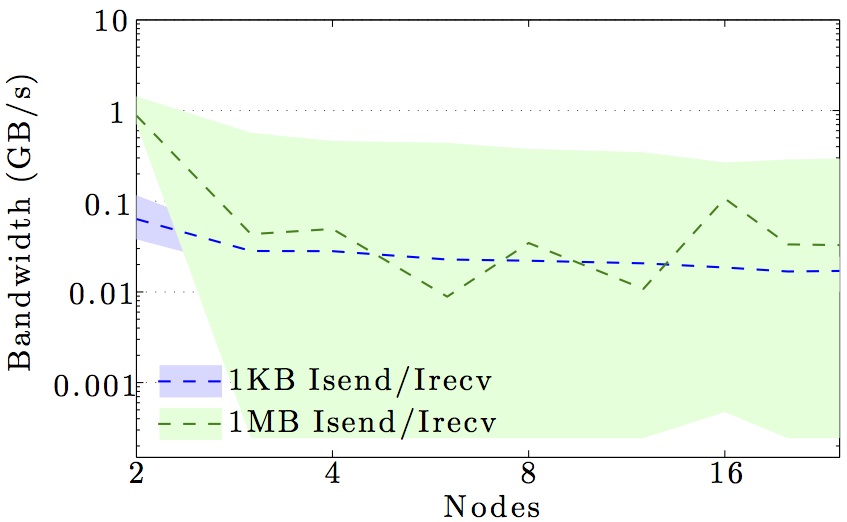
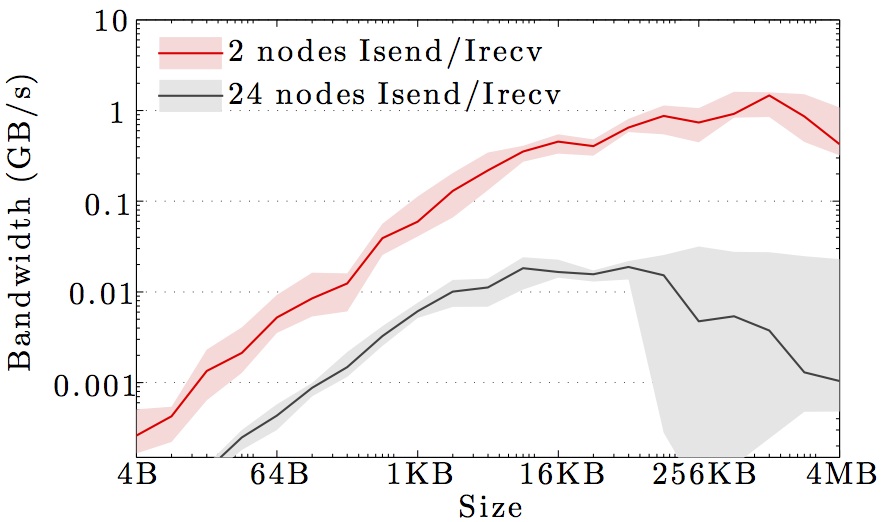
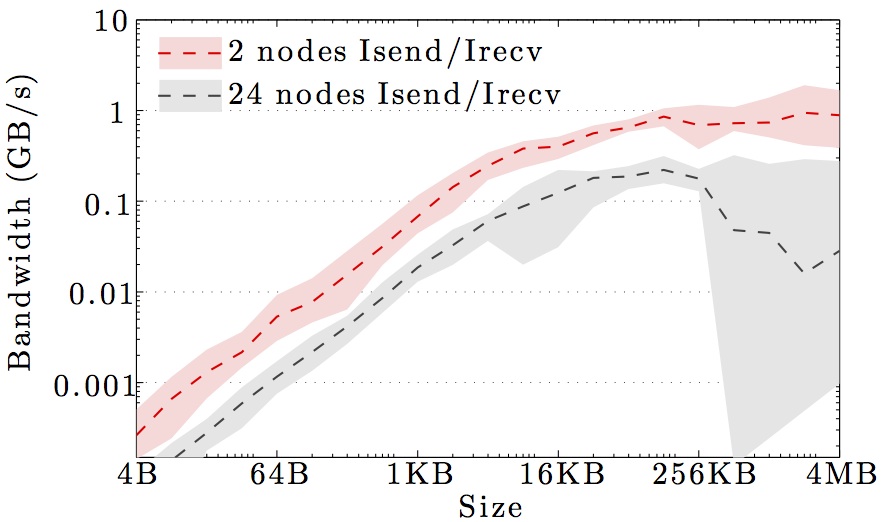
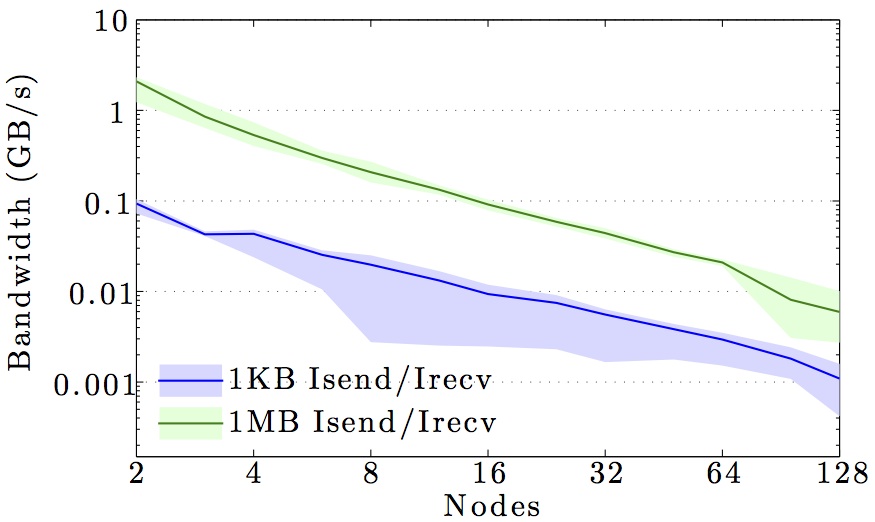
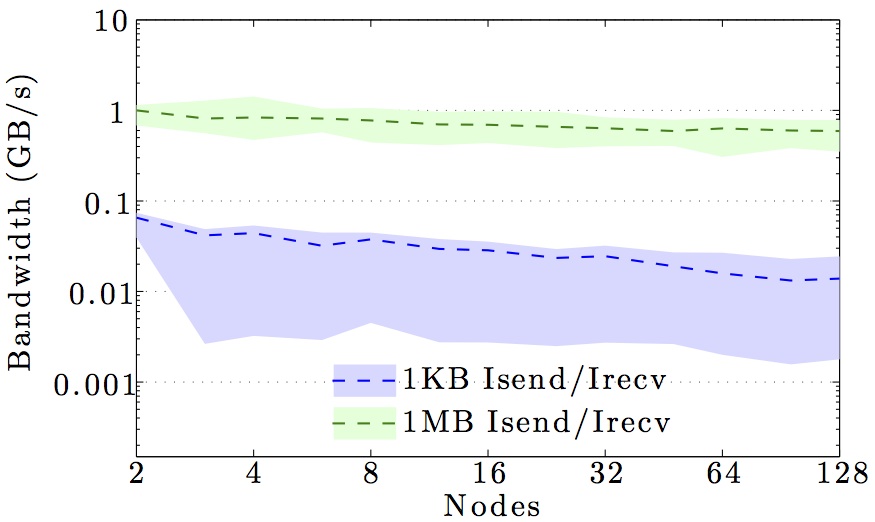
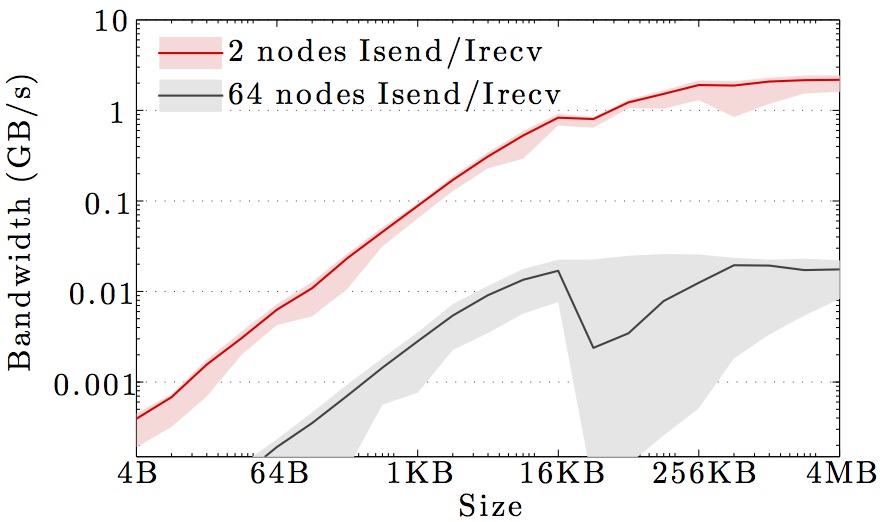
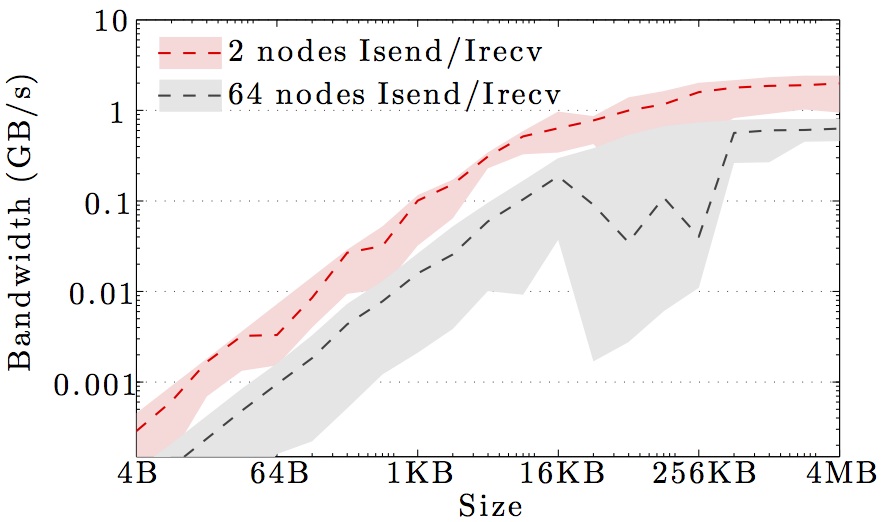
The figures show the bandwidth of non-blocking MPI send and receive operations as a function of number of nodes for 1KB and 1MB message sizes, and as a function of the message size for 2 and max number of nodes.
Full curves are for all-to-all communication and dashed curves are for neighbor-to-neighbor communication in a 1D ring topology. The curves are the average values over 1000 independent trials; the minimum and maximum values envelop the shaded regions.
Click the figures to make them larger.
Note the logarithmic axes. Please also keep in mind that the shown behavior depends heavily on the current load on the cluster apart from the particular settings, wiring, and make of the infiniband cards.
DTU Elektro cluster

DTU Atea HPC cluster
DTU IBM HPC cluster
DTU Fotonano cluster
DTU Risø Jess cluster
SDU Abacus cluster